Corey Ladas and David J Anderson have recently spoken about how lots of software/IT teams using Kanban board have created Cumulative Flow Diagram but few of them have done control (or capability) charts or histogram.
On the software development project I’m the Project Manager of we have started using control charts for several reasons:
- To better understand the variation over time in a number of key areas (how many things we deliver to production each fortnight and how many days it takes from a developer starting for a story to be ready for production.
- To better understand how we can improve our process by separating common cause problems from special cause problems.
Control Chart 1: Features Released to Production
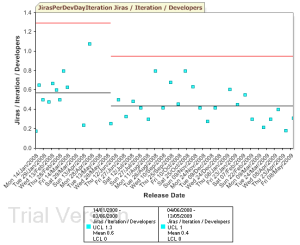
The first control chart we’ve used is the number of Jiras (think Story) we have delivered per iteration length and number of available developers.
I’ve split the periods on the charts to reflect pre- and post-Go Live.
What this chart shows me is that the system is in statistical control. None of the points are outside the Upper Control Limit. There is currently a slight downward trend in the number of Jiras we deliver (six consecutive releases are under the mean).
As the Project Manager I’d like to achieve two things. First, I’d like to increase the amount of value we deliver to our end customers. The first point is tricky since count of Jiras has a very rough correlation with end customer value. I don’t want to encourage the team to focus on the numbers (e.g. I don’t want lots of small stories instead of larger ones, if the larger ones have value). Second, I’d like to reduce the variability over time. I’m puzzling over whether a sizing metric on the stories would help reduce some of the noise in the variation.
Given that the chart shows me that we’re in control and if we want to make improvements on the amount that we deliver each fortnight, we probably need to look for common cause / system-wide influences, rather than a special cause, such as asking the developers to “just work harder”. A lot of the delay recently has been having to deal with other teams within the IT department who have longer lead times than we do. From a systems perspective, improving our ability to work with other teams is where I think we’ll gain more throughput improvements than focusing on improvements within our team.
Cycle Time: From Development to Ready for Release
The second area we have used Control Charts is looking at the time it takes for a Story to progress through the following states in our process (and on the Kanban board):
- Developer Design (Technical Design Discussion, How to Test written)
- Development Underway (Including Code Review if it wasn’t developed by pairing developers)
- Functional Testing (this is where they wait for Test to test them)
- Acceptance Testing (this is where they wait for the BA to test them)
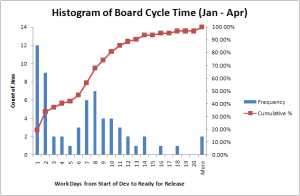
We started out with a histogram to understand the range of times it was taking tasks to cross these columns on the board.
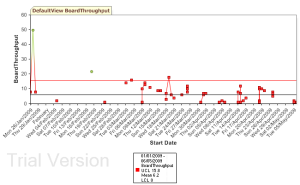
The histogram gives a good overview of how long the tasks are taking, but it’s more interesting to see this in a Control Chart since the Upper Control Limit helps highlight which tasks took excessively long and are likely to be due to special causes that are worth root cause analysing. I prefer the timeline view of the control chart to the histogram since it shows if things are changing over time as well as more clearly illustrating the outliers.
Here we can see that there are two tasks which were excessively long. These were special causes since one was due to working in a new way with another IT team, and the other was due to a “pile up” of work in progress with one developer who was tasked with performance and scalability testing the application (which required co-ordination with other groups to access the testing infrastructure). Removing these two outlier shows some other tasks to investigate, again, mainly around working on tasks that involve co-ordination with other teams.
The charts and histograms in these two areas suggest that the most productive improvements in our development system are going to come from working out ways of working better with other teams.


Leave a Reply